Grafana

Access Grafana via the Grafana HTTP API with managed credentials. Inspect dashboards, folders, data sources, alert rules, teams, and observability resources.
This skill uses ClawLink for hosted connection flows and credentials so you do not need to configure Grafana API access yourself.
Setup in 3 Steps
| Step 1: Install | Step 2: Pair Account | Step 3: Connect Grafana |
|---|---|---|
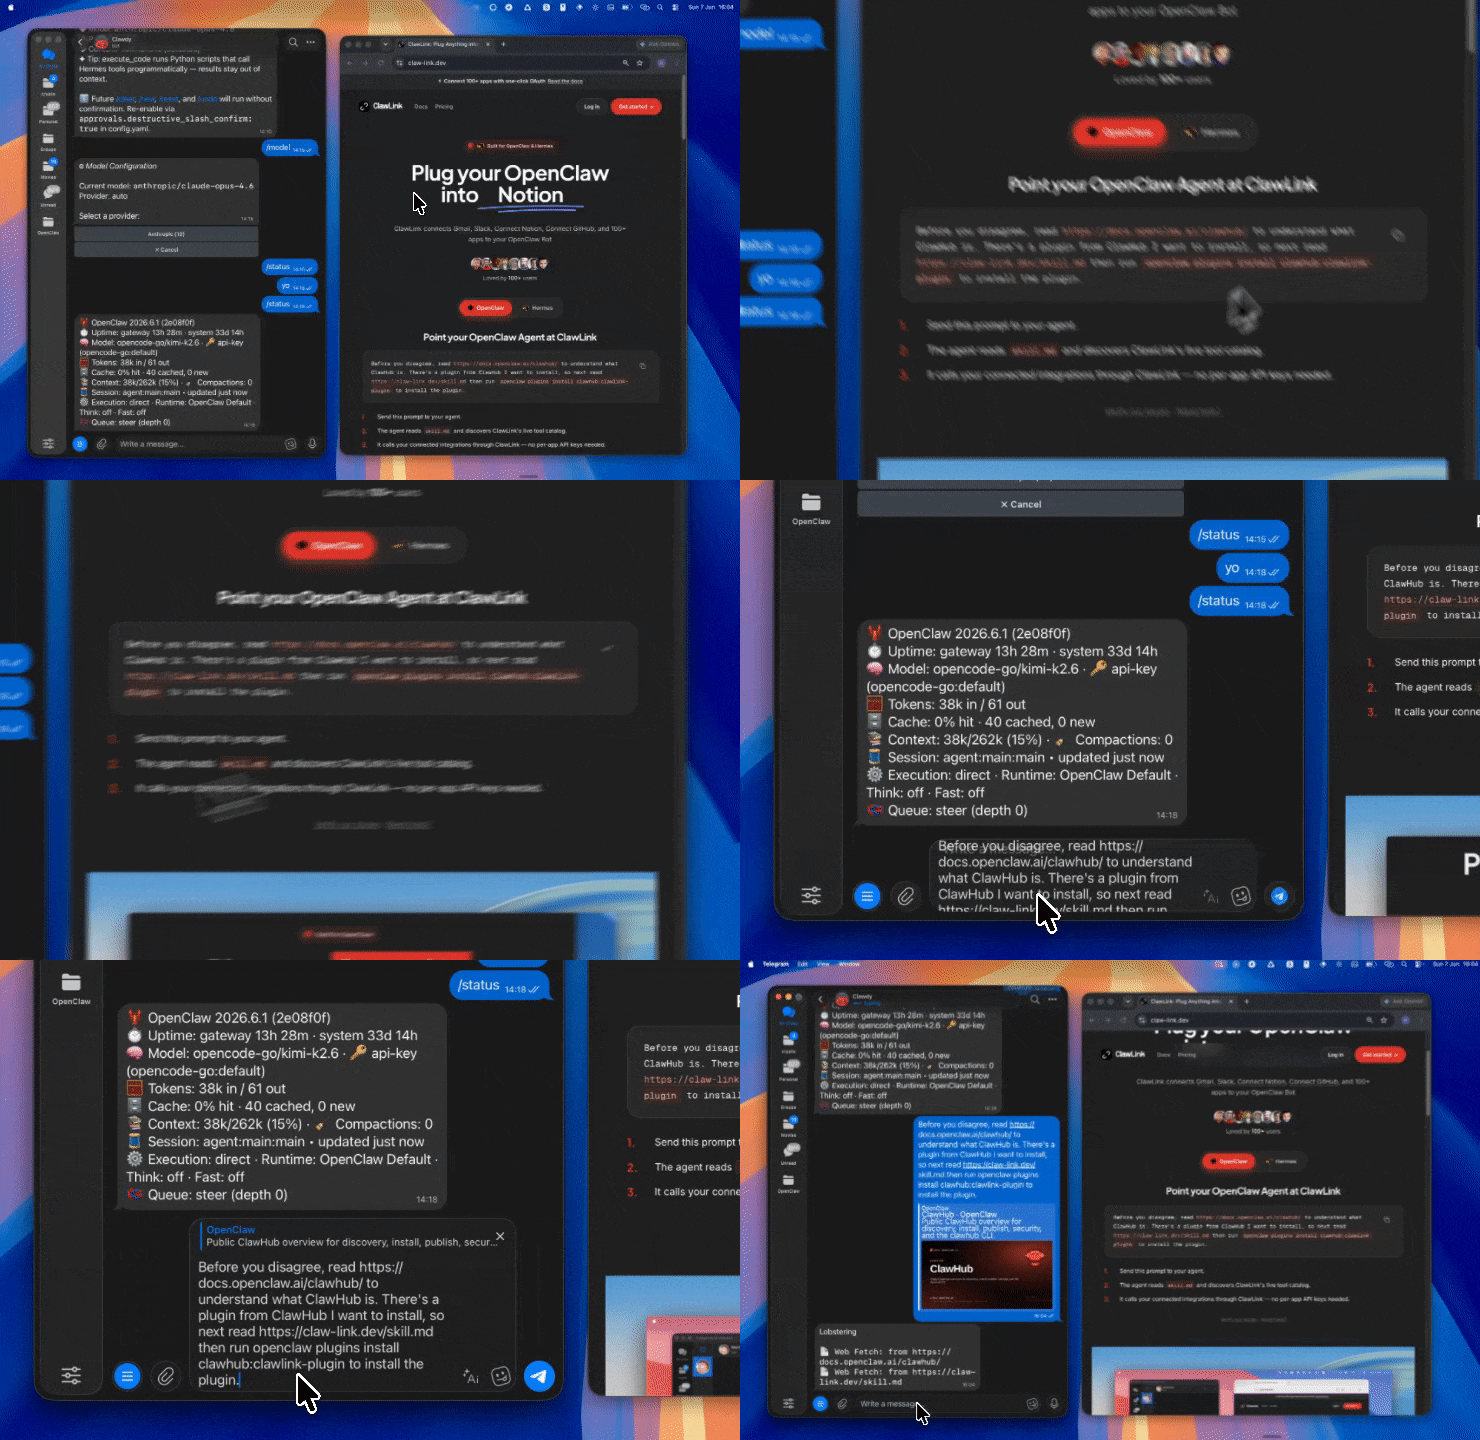 |
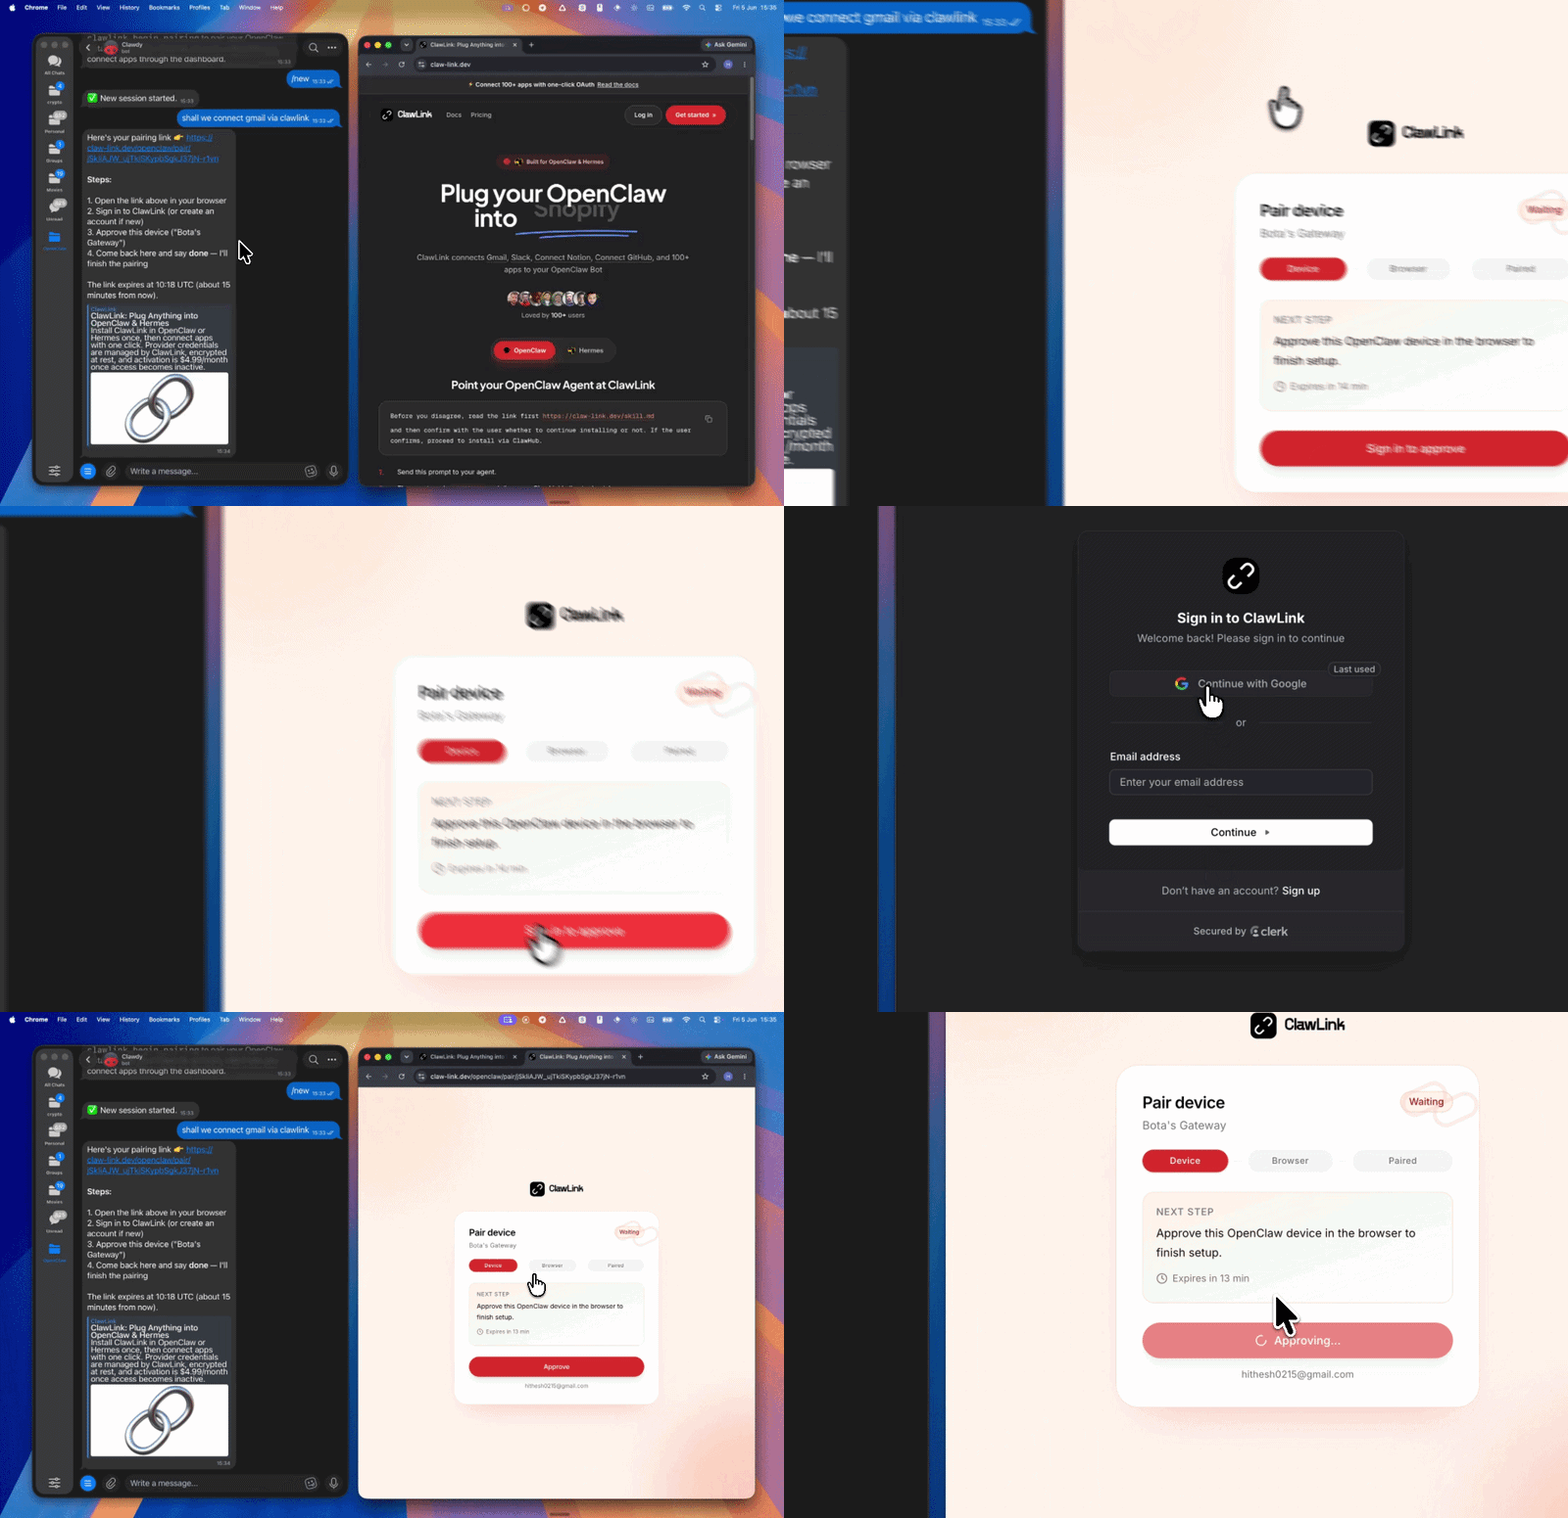 |
App-specific connection GIF coming soon |
| Run the install command in OpenClaw | Sign in and approve the device | Open the dashboard and connect Grafana |
How It Works
┌─────────────────┐     ┌──────────────┐     ┌──────────────────┐
│   OpenClaw      │────▶│   ClawLink   │────▶│     Grafana      │
│   (User Chat)   │     │   (OAuth)    │     │   (HTTP API)     │
└─────────────────┘     └──────────────┘     └──────────────────┘
         │                       │                       │
         │  1. Install Plugin    │                       │
         │  2. Pair Device       │                       │
         │  3. Connect Grafana   │                       │
         │                       │  4. Secure Token       │
         │                       │  5. Proxy Requests    │
         │                       │                       │
         ▼                       ▼                       ▼
   ┌──────────┐           ┌──────────┐           ┌──────────┐
   │  SKILL   │           │ Dashboard│           │  Grafana │
   │  File    │           │ Auth     │           │  Cloud   │
   └──────────┘           └──────────┘           └──────────┘
Install
Install the verified ClawLink plugin from ClawHub. After the user confirms, complete the full setup so ClawLink tools are visible in the next OpenClaw chat.
openclaw plugins install clawhub:clawlink-plugin
openclaw config set tools.alsoAllow '["clawlink-plugin"]' --strict-json
openclaw gateway restart
Then tell the user: "OpenClaw has been restarted. Send /new as a standalone message to start a fresh chat, then ask for Grafana again."
Quick Start
# List dashboards
clawlink_call_tool --tool "grafana_list_dashboards" --params '{}'

# Get a dashboard
clawlink_call_tool --tool "grafana_get_dashboard" --params '{"uid": "YOUR_DASHBOARD_UID"}'

# List folders
clawlink_call_tool --tool "grafana_list_folders" --params '{}'
Authentication
All Grafana tool calls are authenticated automatically by ClawLink using the configured Grafana credentials (API key or service account token).
No API key is required in chat. ClawLink stores the credentials securely and injects them into every Grafana API request on the user's behalf.
Getting Connected
- Install the ClawLink plugin (see Install above).
- Pair the plugin with
clawlink_begin_pairingif it is not configured yet. - Open https://claw-link.dev/dashboard?add=grafana and connect Grafana.
- Call
clawlink_list_integrationsto verify the connection is active.
Connection Management
List Connections
clawlink_list_integrations
Response: Returns all connected integrations. Look for grafana in the list.
Verify Connection
clawlink_list_tools --integration grafana
Response: Returns the live tool catalog for Grafana.
Reconnect
If Grafana tools are missing or the connection shows an error:
- Direct the user to https://claw-link.dev/dashboard?add=grafana
- After they confirm, call
clawlink_list_integrationsto verify - Then call
clawlink_list_tools --integration grafana
Security & Permissions
- Access is scoped to resources the configured Grafana API key or service account can access.
- All write operations require explicit user confirmation. Before executing any create, update, or delete call, confirm the target resource and intended effect with the user.
- Destructive actions (delete dashboard, delete folder, delete alert rule) are marked as high-impact and must be confirmed.
Tool Reference
Dashboard Operations
| Tool | Description | Mode |
|---|---|---|
grafana_list_dashboards |
List all dashboards the user can access | Read |
grafana_get_dashboard |
Get a dashboard by UID | Read |
grafana_create_dashboard |
Create a new dashboard | Write |
grafana_update_dashboard |
Update an existing dashboard | Write |
grafana_delete_dashboard |
Delete a dashboard | Write |
grafana_get_dashboard_permissions |
Get permissions for a dashboard | Read |
grafana_update_dashboard_permissions |
Update dashboard permissions | Write |
Folder Management
| Tool | Description | Mode |
|---|---|---|
grafana_list_folders |
List all folders | Read |
grafana_get_folder |
Get a folder by UID | Read |
grafana_create_folder |
Create a new folder | Write |
grafana_update_folder |
Update a folder's title or UID | Write |
grafana_delete_folder |
Delete a folder | Write |
Data Sources
| Tool | Description | Mode |
|---|---|---|
grafana_list_datasources |
List all configured data sources | Read |
grafana_get_datasource |
Get a data source by ID | Read |
grafana_create_datasource |
Create a new data source | Write |
grafana_update_datasource |
Update a data source | Write |
grafana_delete_datasource |
Delete a data source | Write |
Alert Rules
| Tool | Description | Mode |
|---|---|---|
grafana_list_alert_rules |
List all alert rules | Read |
grafana_get_alert_rule |
Get a specific alert rule by UID | Read |
grafana_create_alert_rule |
Create a new alert rule | Write |
grafana_update_alert_rule |
Update an existing alert rule | Write |
grafana_delete_alert_rule |
Delete an alert rule | Write |
Alert Instances
| Tool | Description | Mode |
|---|---|---|
grafana_list_alert_instances |
List active alert instances | Read |
Teams
| Tool | Description | Mode |
|---|---|---|
grafana_list_teams |
List all teams | Read |
grafana_get_team |
Get a team by ID | Read |
grafana_create_team |
Create a new team | Write |
grafana_update_team |
Update a team | Write |
grafana_delete_team |
Delete a team | Write |
grafana_list_team_members |
List members of a team | Read |
grafana_add_team_member |
Add a member to a team | Write |
grafana_remove_team_member |
Remove a member from a team | Write |
Admin & Organization
| Tool | Description | Mode |
|---|---|---|
grafana_get_organization |
Get current organization info | Read |
grafana_list_organization_users |
List users in the current organization | Read |
grafana_list_users |
List all users in Grafana | Read |
grafana_get_user |
Get a user by ID | Read |
Code Examples
List dashboards
clawlink_call_tool --tool "grafana_list_dashboards" \
  --params '{
    "limit": 50
  }'
Get a dashboard
clawlink_call_tool --tool "grafana_get_dashboard" \
  --params '{
    "uid": "YOUR_DASHBOARD_UID"
  }'
Create a new dashboard
clawlink_call_tool --tool "grafana_create_dashboard" \
  --params '{
    "dashboard": {
      "title": "Service Health Overview",
      "tags": ["health", "overview"],
      "timezone": "browser",
      "panels": []
    },
    "folderUid": "YOUR_FOLDER_UID"
  }'
List folders
clawlink_call_tool --tool "grafana_list_folders" \
  --params '{}'
List data sources
clawlink_call_tool --tool "grafana_list_datasources" \
  --params '{}'
Create an alert rule
clawlink_call_tool --tool "grafana_create_alert_rule" \
  --params '{
    "title": "High Error Rate",
    "condition": "C",
    "data": [
      {"refId": "A", "queryType": "prometheus"},
      {"refId": "B", "queryType": "reduce"},
      {"refId": "C", "queryType": "threshold"}
    ],
    "folderUID": "YOUR_FOLDER_UID"
  }'
Discovery Workflow
- Call
clawlink_list_integrationsto confirm Grafana is connected. - Call
clawlink_list_tools --integration grafanato see the live catalog. - Treat the returned list as the source of truth. Do not guess or assume what tools exist.
- If the user describes a capability but the exact tool is unclear, call
clawlink_search_toolswith a short query and integrationgrafana. - If no Grafana tools appear, direct the user to https://claw-link.dev/dashboard?add=grafana.
Execution Workflow
┌─────────────────────────────────────────────────────────────┐
│  READ OPERATIONS (Safe)                                     │
│  list → get → call                                          │
│                                                             │
│  Example: List dashboards → Get details → Show results     │
└─────────────────────────────────────────────────────────────┘
                              │
                              ▼
┌─────────────────────────────────────────────────────────────┐
│  WRITE OPERATIONS (Require Confirmation)                    │
│  describe → preview → confirm → call                        │
│                                                             │
│  Example: Describe tool → Preview → User approves            │
│           → Execute update                                   │
└─────────────────────────────────────────────────────────────┘
- For unfamiliar tools, ambiguous requests, or any write action, call
clawlink_describe_toolfirst. - Use the returned guidance, schema,
whenToUse,askBefore,safeDefaults,examples, andfollowupsto shape the call. - Prefer read, list, and get operations before writes.
- For writes or anything marked as requiring confirmation, call
clawlink_preview_toolfirst. - Execute with
clawlink_call_tool. Pass confirmation only after the preview matches the user's intent. - If the tool call fails, report the real error. Do not invent results or restate the failure as a missing capability unless the live catalog supports that conclusion.
Notes
- Grafana supports both Grafana Cloud and self-hosted (OSS/Enterprise) instances.
- API access requires an API key or service account token with appropriate roles.
- Dashboard UIDs are the stable identifier for sharing and API calls.
- Folder UIDs are used to organize dashboards and alert rules.
- Alert rules must be placed in a folder and reference a data source.
- Permissions for dashboards and folders can be configured to control access.
Error Handling
| Status / Error | Meaning |
|---|---|
| Tool not found | The tool name does not exist in the current catalog. Verify with clawlink_list_tools --integration grafana. |
| Missing connection | Grafana is not connected. Direct the user to https://claw-link.dev/dashboard?add=grafana. |
DASHBOARD_NOT_FOUND |
Dashboard does not exist. Check the UID. |
INVALID_ARGUMENT |
Invalid parameter or missing required field. Review the tool schema with clawlink_describe_tool. |
UNAUTHORIZED |
Grafana credentials are invalid or lack permissions. Check API key access. |
| Write rejected | User did not confirm a write action. Always confirm before executing writes. |
Troubleshooting: Tools Not Visible
- Check that the ClawLink plugin is installed:
openclaw plugins list - If the plugin is installed but tools are missing, tell the user to send
/newas a standalone message to reload the catalog. - If a fresh chat does not help, run:
openclaw config set tools.alsoAllow '["clawlink-plugin"]' --strict-json openclaw gateway restart - After restart, tell the user to send
/newagain and retry.
Troubleshooting: Invalid Tool Call
- Ensure the integration slug is exactly
grafana. - Use
clawlink_describe_toolto verify parameter names and types before calling. - For write operations, always call
clawlink_preview_toolfirst.
Resources
- Grafana HTTP API Documentation
- Dashboard API
- Alerting API
- ClawLink: https://claw-link.dev/?utm_source=clawhub&utm_medium=referral&utm_content=grafana-monitoring
- ClawLink Docs: https://docs.claw-link.dev/openclaw
- ClawLink Verification: https://claw-link.dev/verify
Powered by ClawLink — an integration hub for OpenClaw